Here, we list a few open problems and our solutions in the space of accessibility of biological data.

Accessibility of Genomic Visualization

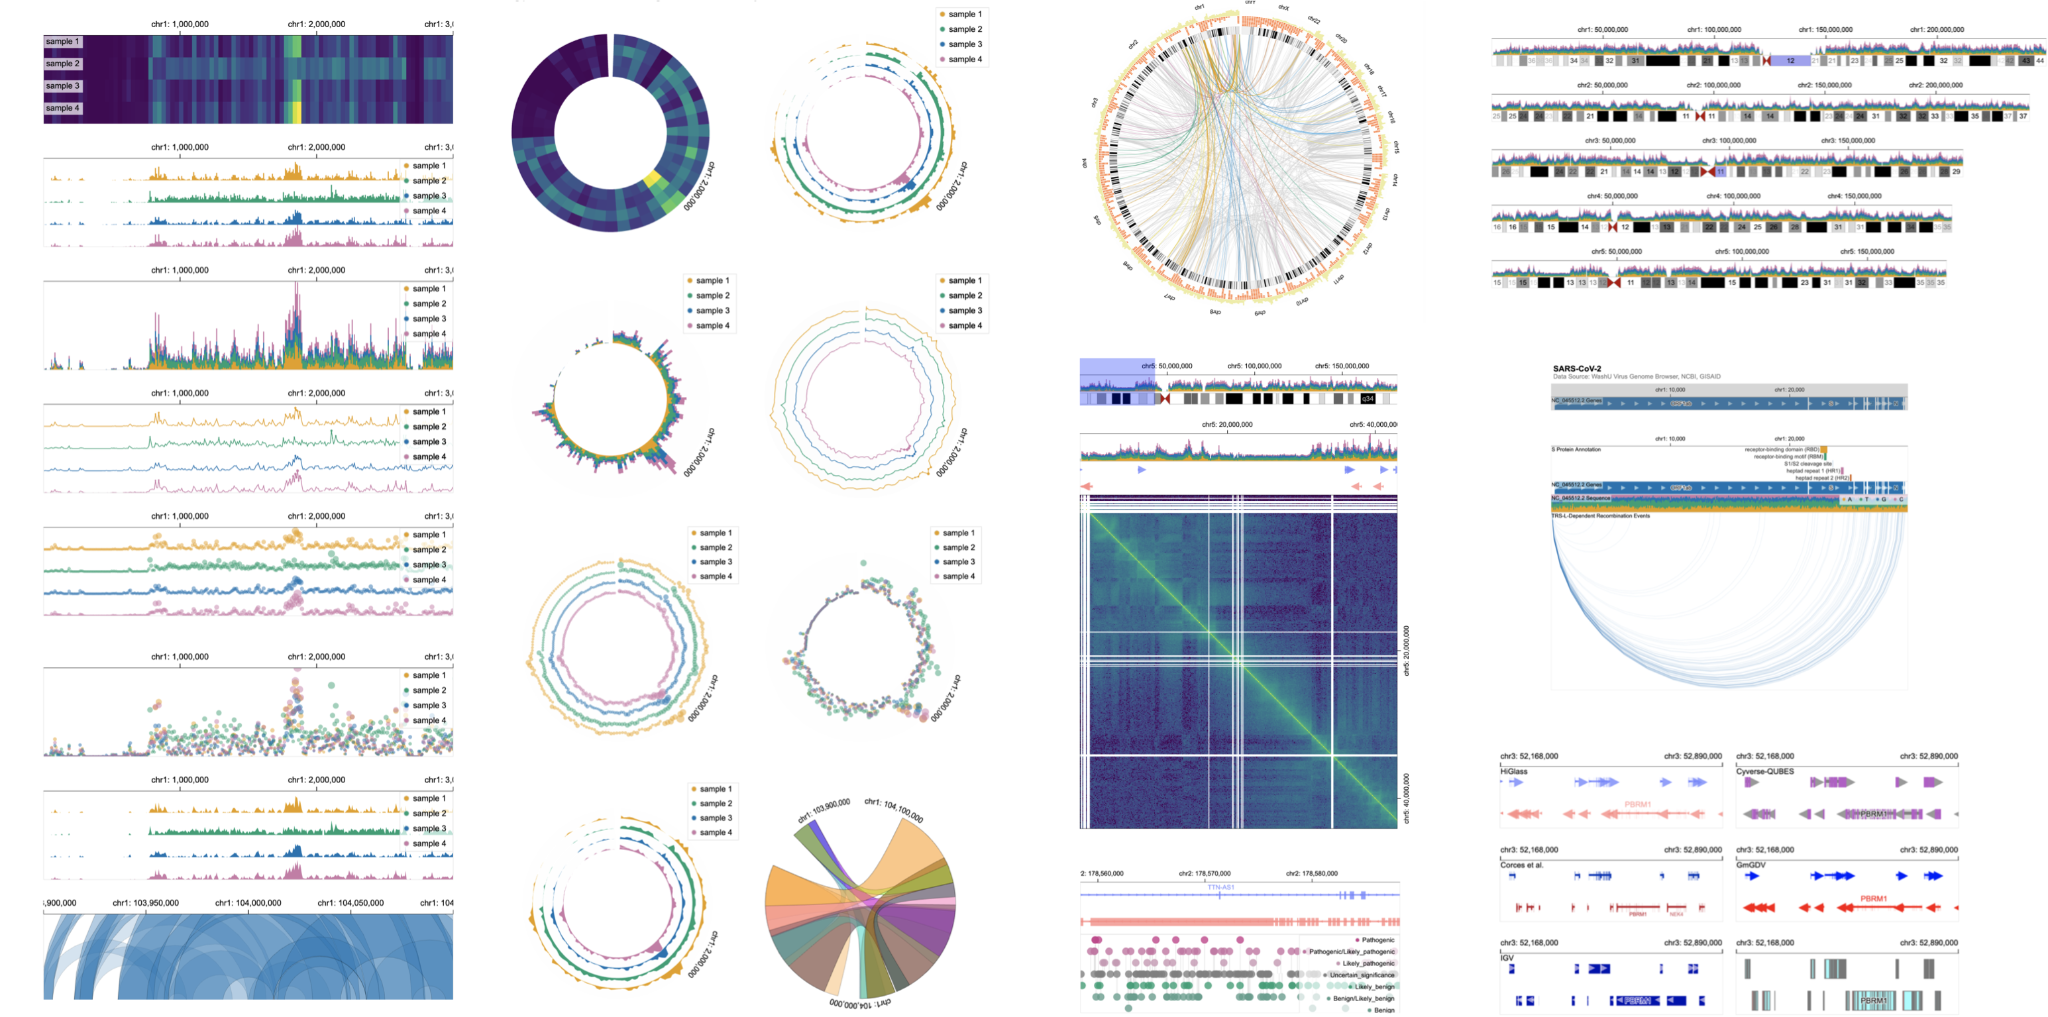
There are several unique aspects about genomic visualization, such as the variety of visualization designs. These aspects make it even more difficult to make genomic visualization accessible.

A gallery of genomics data visualization drawn using Gosling, including linear and circular visualizations, matrix, lollipop plots, ideograms, and gene tracks.

  • Challenges
    • Variety of visualization designs (e.g., Circos, Sequence Logos)
    • Many visualizations at once (8.1 tracks on average)
    • User interactions (e.g., zoom and pan)

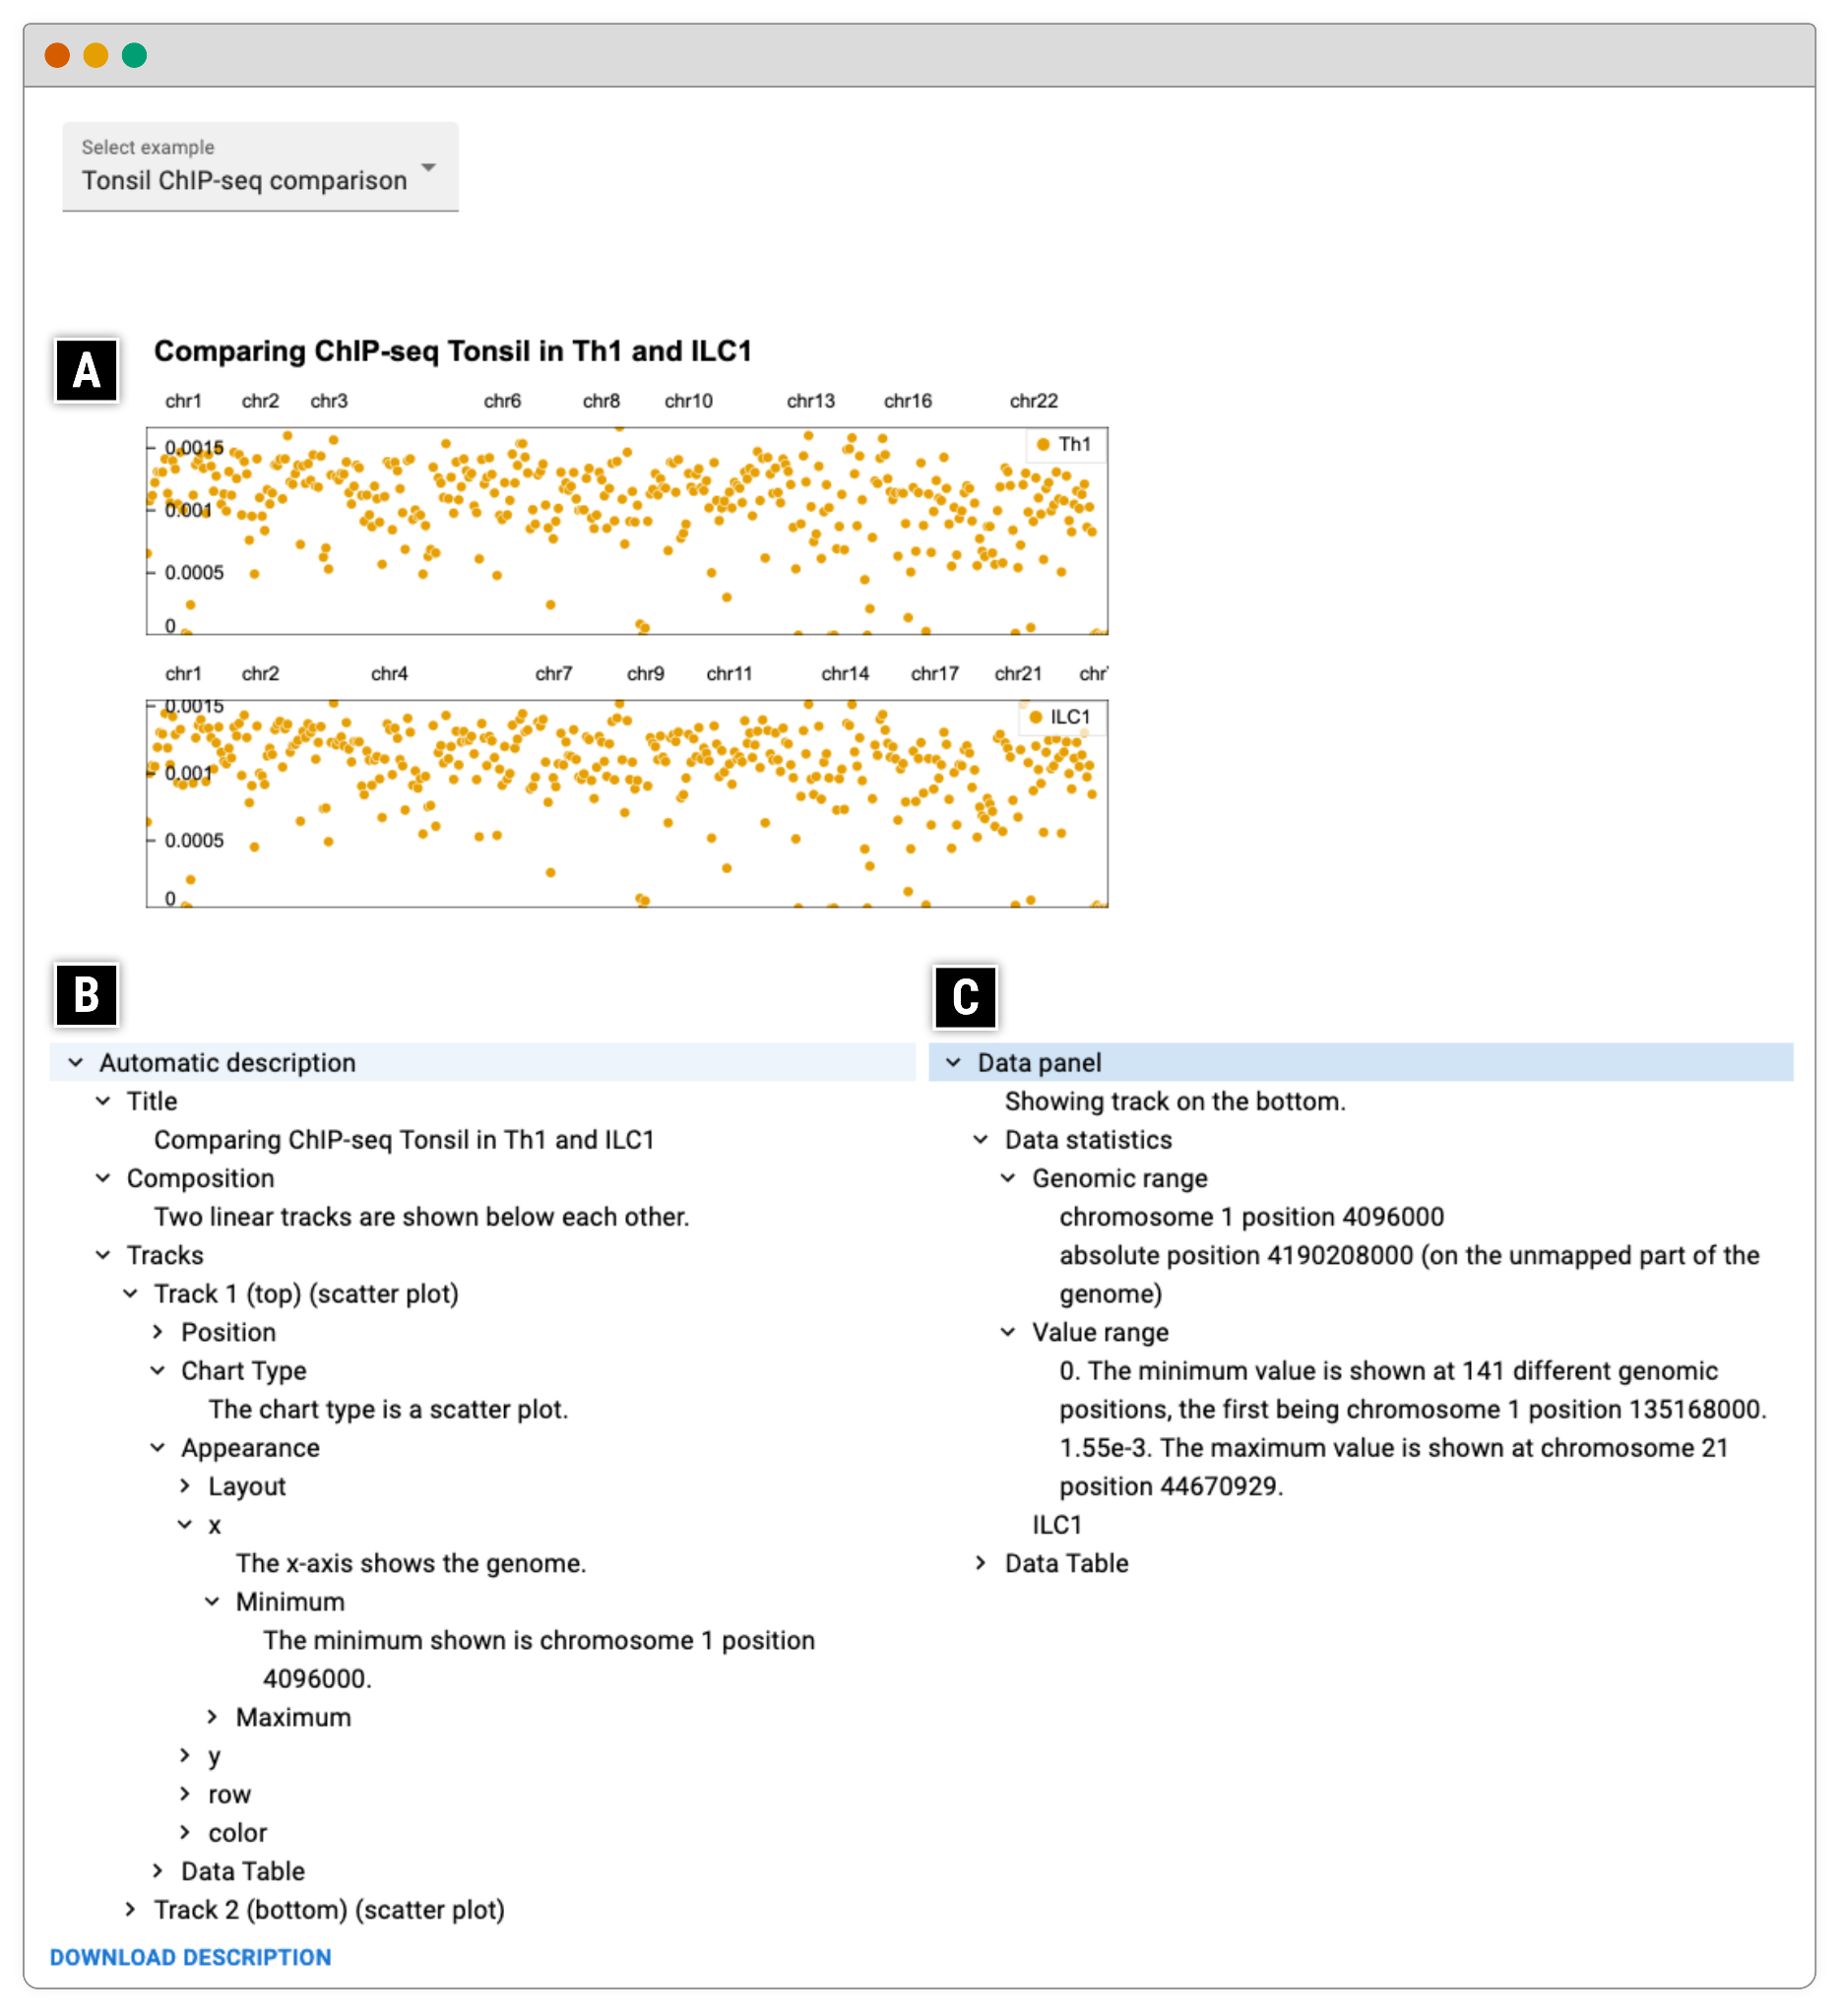
AltGosling (Demo, Paper)

  • Automatic generation of text descriptions for accessible genomics data visualization
  • AltGosling uses structured information in Gosling specifications in JSON to automatically create human-readable descriptions that describe the given visualization.
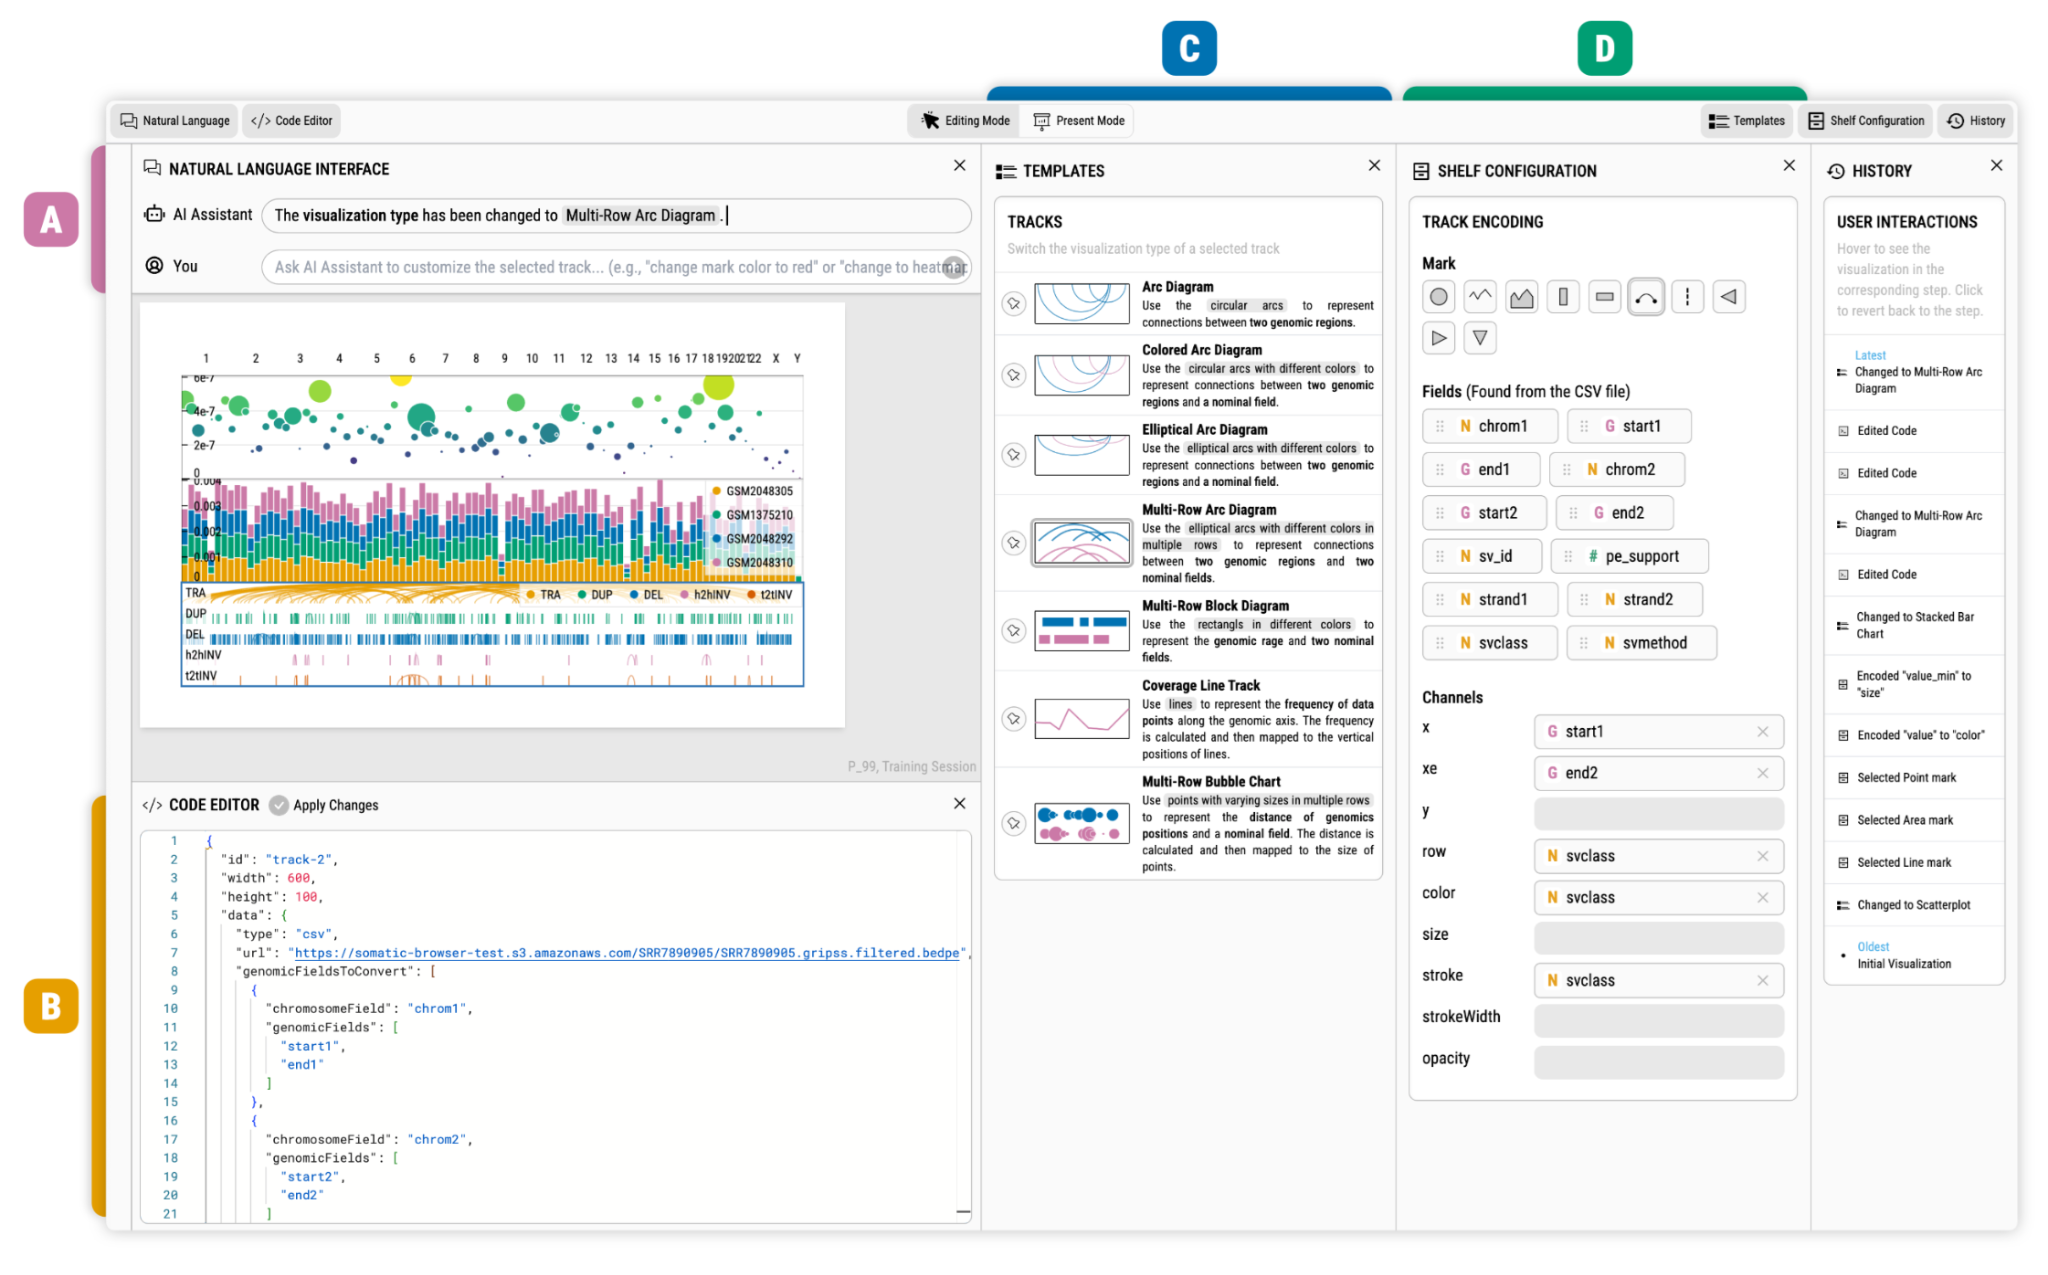
Schematic with two sections. On the top left is a file icon with 'Gosling Spec.' This points to the right section, labeled 'Gosling.js,' and the bottom section, labeled 'AltGosling.' Caption. A schematic representation of the AltGosling approach. AltGosling (D) extracts information about visual representations and underlying data of a genomics data visualization (C) from the Gosling JSON specification (A) and the Gosling renderer (B). Based on the extracted features, AltGosling offers alternative text (“alt text”), long descriptions, and tree-structured keyboard-navigable descriptions. The separation of feature extraction (D) and the rendering of textual descriptions (E–G) offers flexibility in delivery.

Screenshot of AltGosling in browser. On top is a Gosling visualization with two scatter plots. Below are two partially expanded panels, showing information such as title, tracks, appearance, and data table.

Blace (Paper)

  • LLM-based Multimodal Visualization Authoring
  • Through multimodal interactions, including chatbot interfaces, uesrs can more easily interactive with the system and build complex genomic data visualizations.

A screenshot of Blace showing four main panels, including a natural language interface, labeled "A," a code editor, labeled "B," a template interface, labeld "C," and a shelf configuration interface, labeled "D."

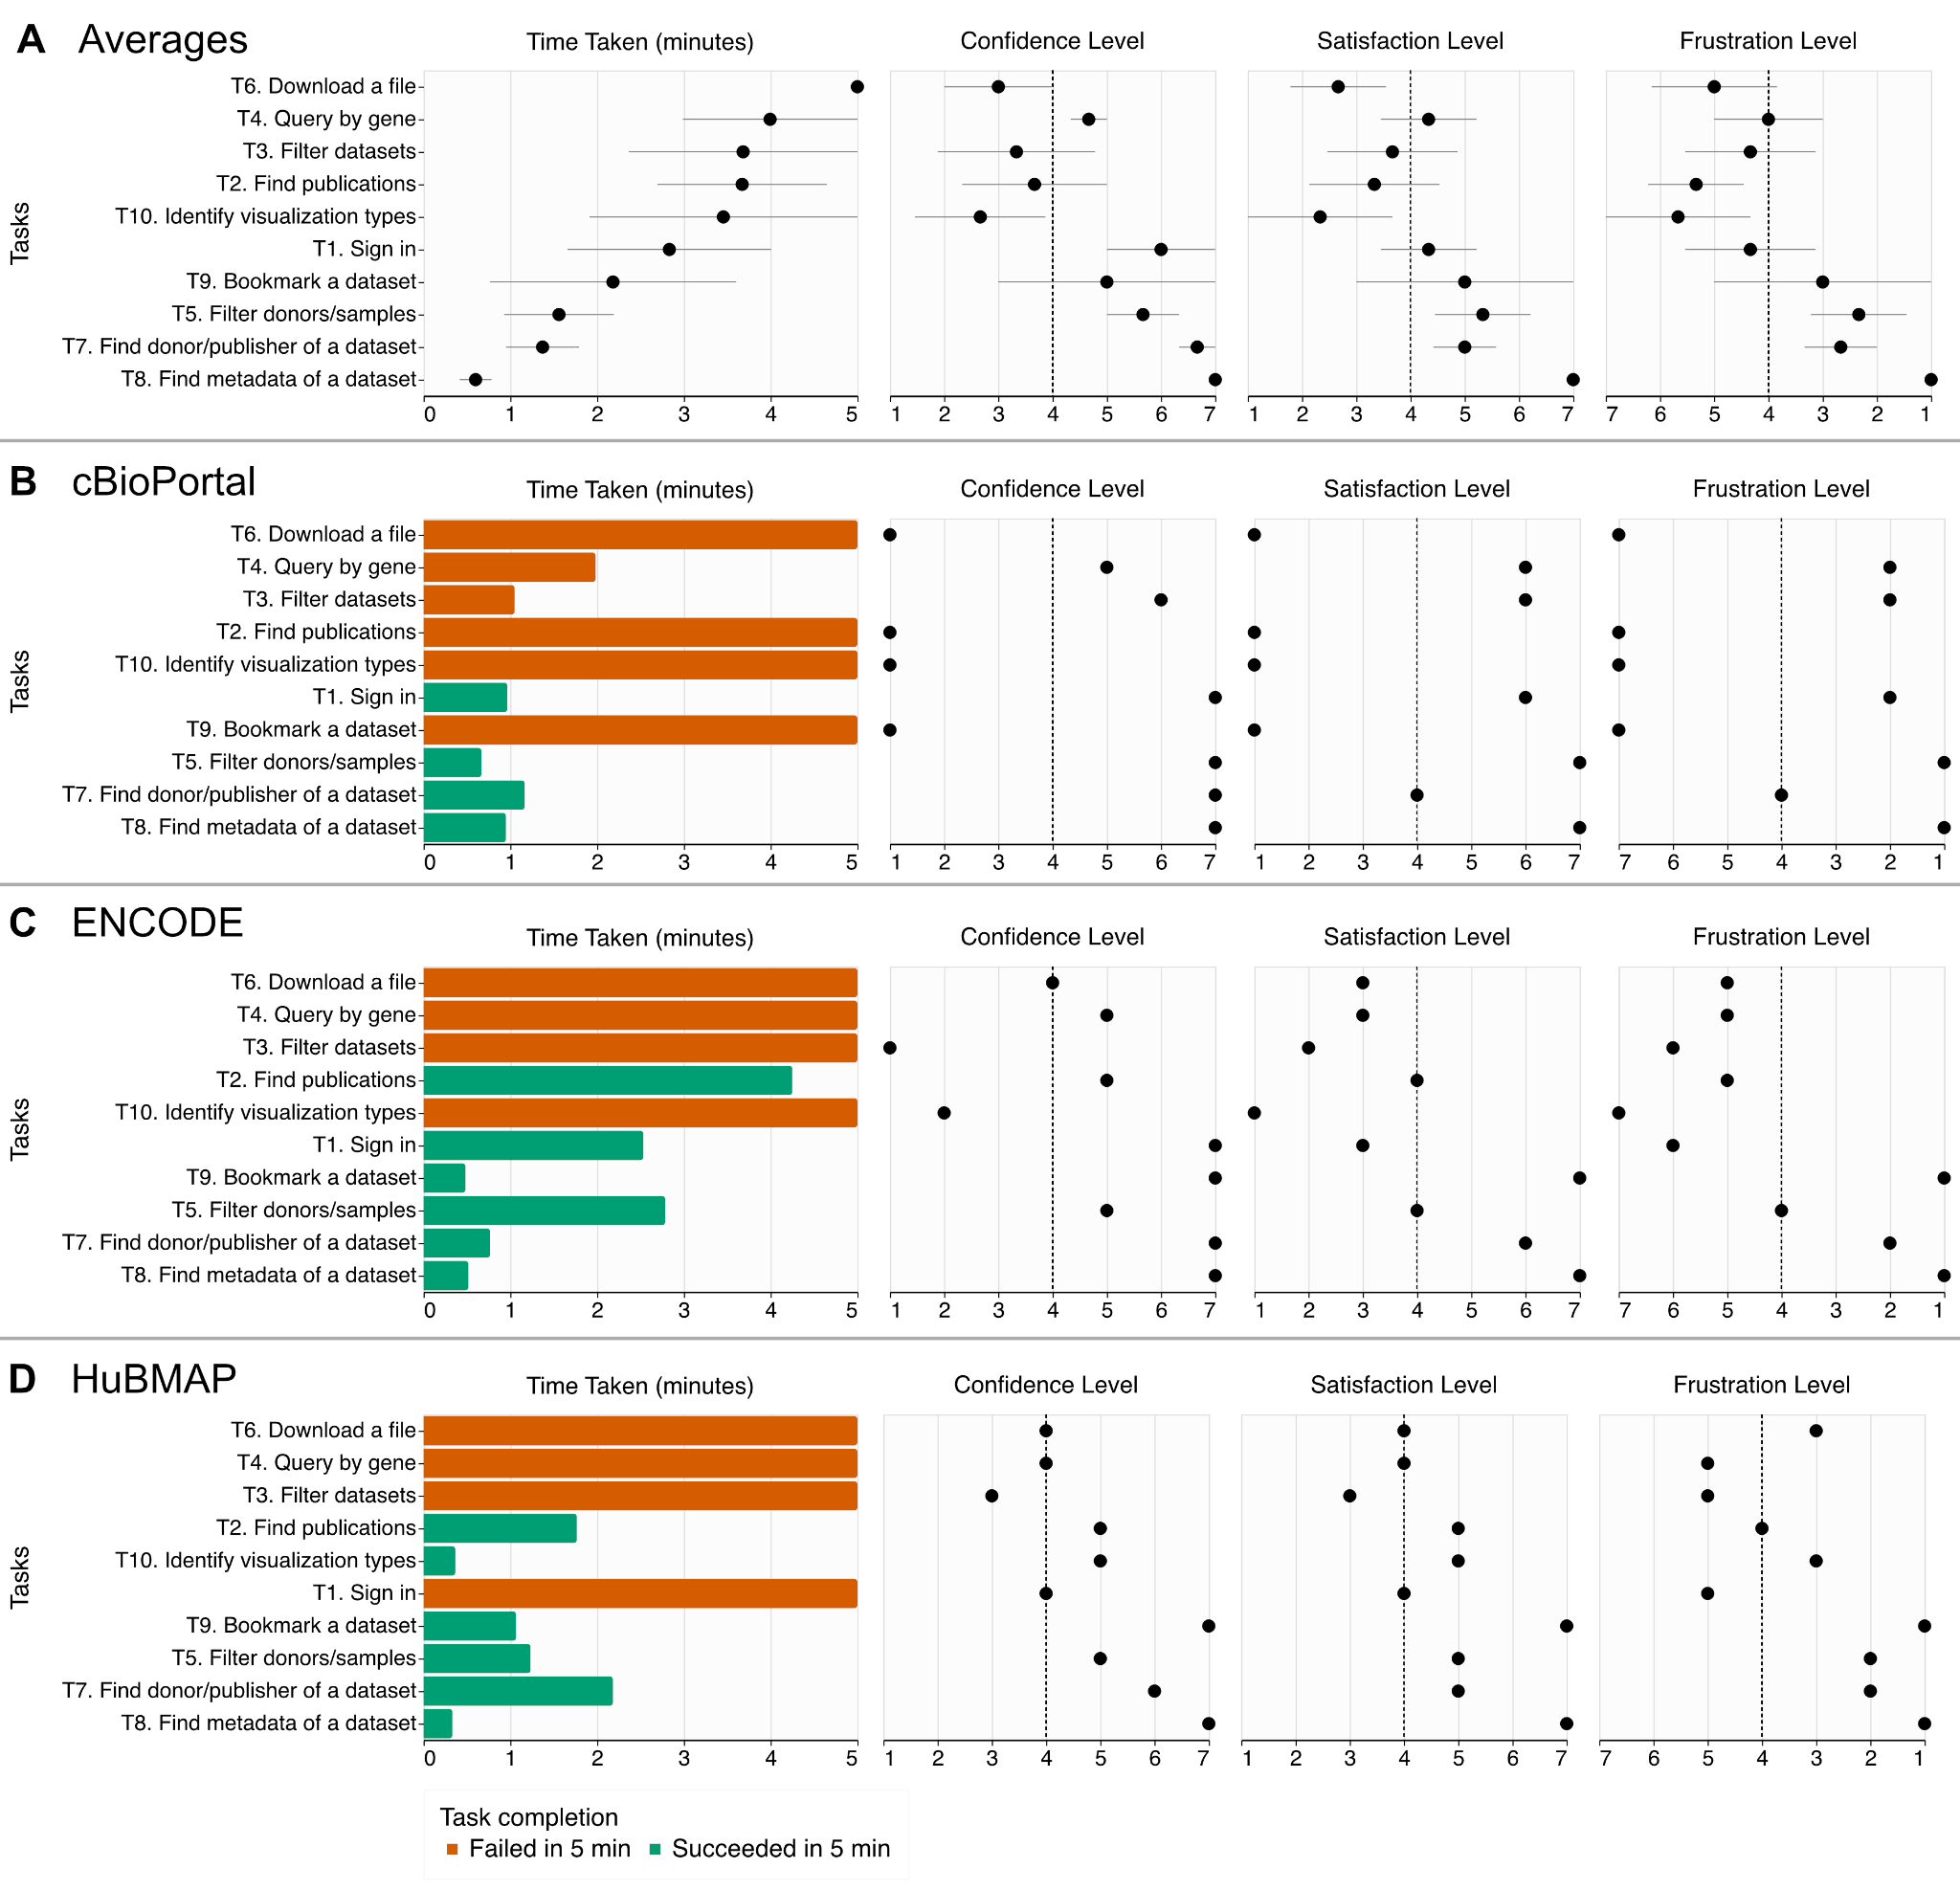
Accessibility of Data Portals

In our study, only 55.3% were successful for a screen reader to perform common tasks in data portals (inscidar.org).

Four subpanels show the results of the manual accessibility evaluation results, showing time taken each of the 10 tasks and subjective responses on confidence, satisfaction, and frustration levels. The first subpanel shows the summary of the results for three data portals while the rest show the individual results for data portals.

INSCIDAR Project

You can visit our project website (inscidar.org) to see our evaluation results and visualizations. We will run accessibility evaluation annually and release the results in this website.